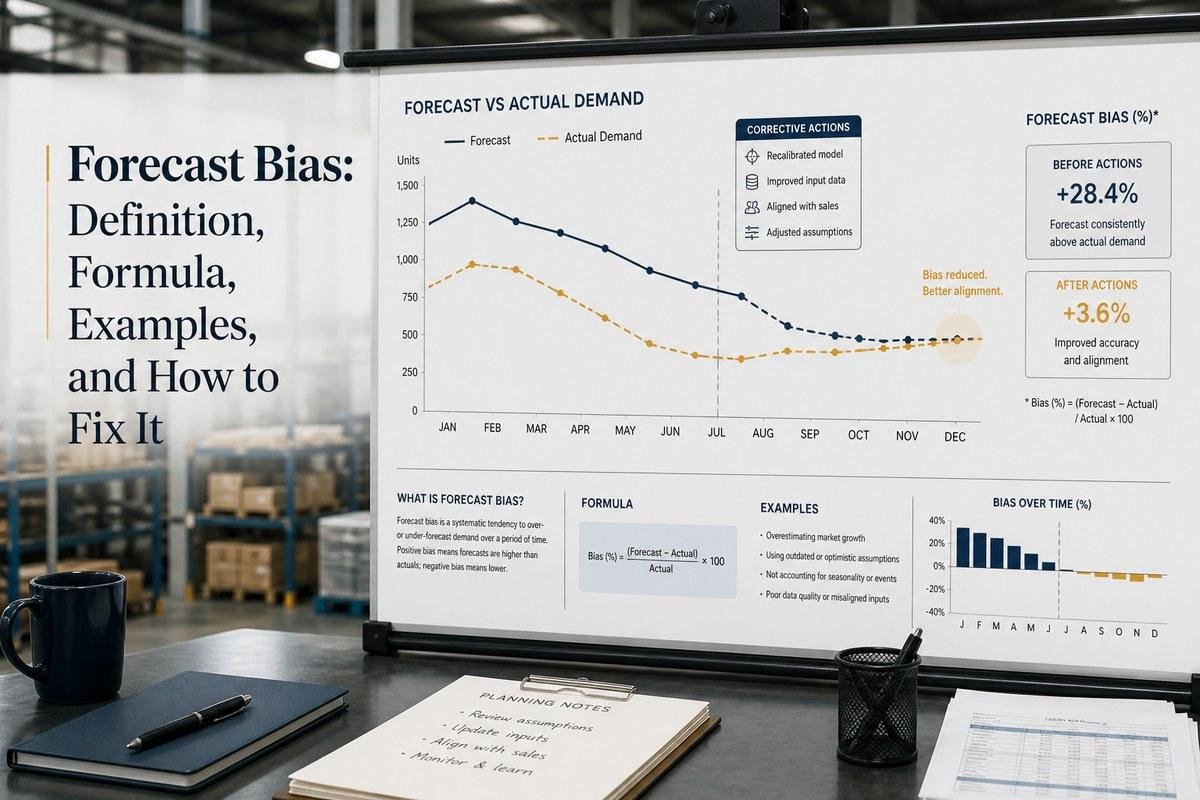
Forecast bias is the tendency for forecasts to be consistently higher or lower than actual demand. A forecast can be wrong without being biased: random over- and under-forecasts may balance over time. Bias exists when the errors repeatedly lean in one direction.
The calculation is easy; the sign convention is the trap. Some teams define error as forecast minus actual, while others use actual minus forecast. Both conventions can work, but positive bias means opposite things under the two formulas. State the formula beside every dashboard.
What is forecast bias?
Forecast bias measures systematic directional error. If a manufacturer repeatedly forecasts 1,200 units and sells about 1,000, the process has an over-forecasting bias. If it repeatedly forecasts 800 and sells about 1,000, it has an under-forecasting bias.
The Institute of Business Forecasting and Planning defines bias as a consistent difference between actual sales and the forecast. Consistency is the important word. One unusually high month may be noise; the same direction across many forecast cycles signals a structural assumption, incentive, data, or process problem.
One caution when comparing sources: industry glossaries and textbooks do not share a single sign convention, and some reference material expresses error as actual minus forecast, which flips the meaning of a positive number. Before comparing your dashboard with any published benchmark, check which formula that source declares.
What is the forecast bias formula?
Calculate forecast bias by summing signed forecast errors across the review period, then divide by total actual demand if a percentage is needed. The safest convention is Forecast − Actual: positive values indicate over-forecasting and negative values indicate under-forecasting.
Forecast error = Forecast − Actual
Cumulative forecast bias = Σ(Forecast − Actual)
Forecast bias % = Σ(Forecast − Actual) ÷ Σ(Actual) × 100
With this convention, a positive result means over-forecasting and a negative result means under-forecasting. If your organization defines error as Actual − Forecast, reverse those interpretations.
IBF uses the opposite sign convention in its glossary. Its positive bias means under-forecasting because the calculation is interpreted in the Actual − Forecast direction. This article uses Forecast − Actual, so a positive result means over-forecasting. Neither convention is inherently wrong; mixing them on one dashboard is.
| Declared error convention | Positive bias means | Negative bias means |
|---|---|---|
| Forecast − Actual | Over-forecasting | Under-forecasting |
| Actual − Forecast | Under-forecasting | Over-forecasting |
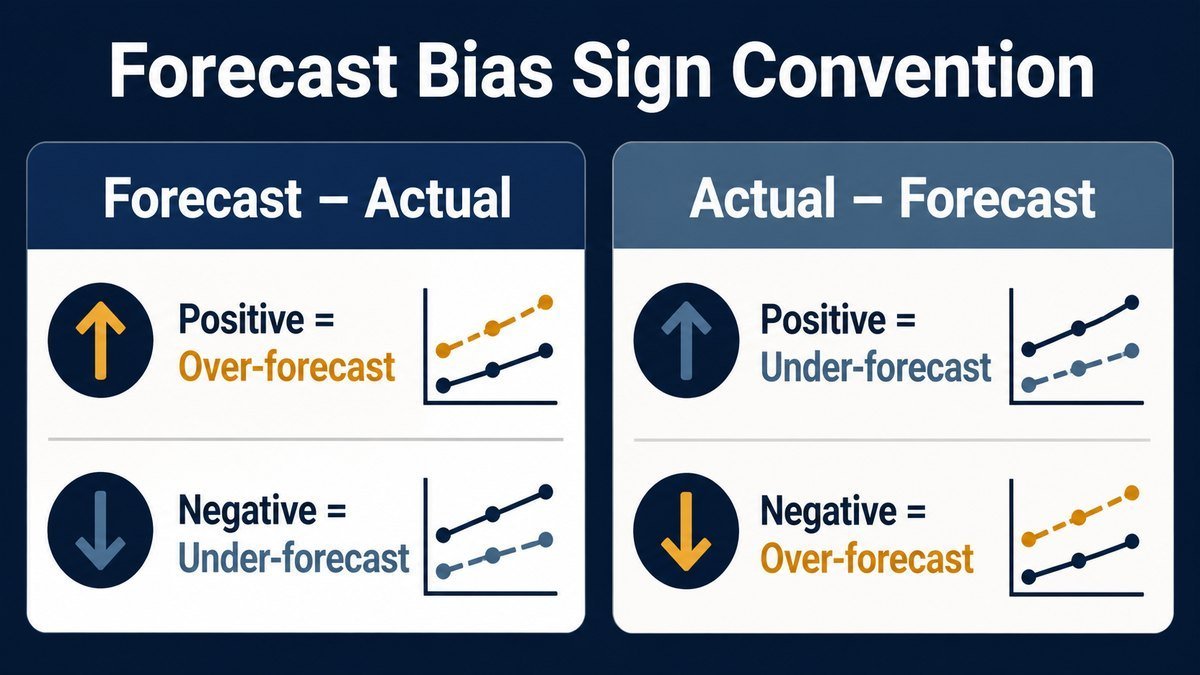
Never label a dashboard only “Bias +8%.” Label it “Bias +8%, Forecast − Actual,” or add a legend saying “positive = over-forecast.” That one line prevents teams from taking the wrong corrective action.
Forecast bias calculation example
Suppose a planner freezes a monthly forecast for a component family and later records actual demand:
| Month | Forecast | Actual | Error: Forecast − Actual |
|---|---|---|---|
| January | 1,100 | 1,000 | +100 |
| February | 1,250 | 1,100 | +150 |
| March | 1,200 | 1,050 | +150 |
| April | 1,150 | 1,100 | +50 |
| Total | 4,700 | 4,250 | +450 |
The unit bias is +450. The percentage bias is 450 ÷ 4,250 × 100 = +10.6%. Under the declared Forecast − Actual convention, the process over-forecast demand by 10.6% across the four months.
This does not prove the next forecast should simply be cut by 10.6%. First find the cause. The same total could come from an expired promotion override, double-counted pipeline, an unrealistic sales target, lost distribution, or a baseline model that reacts too slowly.
Forecast bias vs. forecast accuracy
Bias answers which direction are we usually wrong? Accuracy measures how large are the errors? A planning scorecard needs both because signed errors can cancel.
Consider two forecasts with four monthly errors:
| Series | Monthly errors | Cumulative bias | Interpretation |
|---|---|---|---|
| A | +100, −100, +100, −100 | 0 | Unbiased overall, but not accurate. |
| B | +50, +50, +50, +50 | +200 | Smaller individual errors, but systematically over-forecast. |
Mean absolute error, MAE, averages the absolute unit errors. Mean absolute percentage error, MAPE, expresses absolute error relative to actual demand but behaves badly when actual values are zero or very small. Weighted absolute percentage error, WAPE, divides total absolute error by total actual demand and is often more stable for aggregate business reporting. RELEX’s guide to forecast accuracy compares common measures and highlights why the metric should fit the planning context.
| Measure | Question it answers | Main weakness |
|---|---|---|
| Bias (Σ signed error) | Which direction are we usually wrong? | Opposite errors cancel across items and periods |
| MAE | How large is the typical unit error? | Hard to compare across items with different volumes |
| MAPE | How large is the error in percentage terms? | Explodes when actual demand is zero or tiny |
| WAPE | How large is total error relative to total demand? | Stable, but hides which items drive the error |
| Tracking signal | Is the directional error abnormal versus noise? | The threshold must fit the demand pattern |
Formulas, a shared worked dataset, and selection rules for each measure are in the forecast accuracy metrics guide.
How is forecast bias different from a tracking signal?
Cumulative bias grows with volume and time, so a +500-unit bias may be trivial for one product family and severe for another. A tracking signal normalizes cumulative error by a typical absolute error measure:
Tracking signal = Cumulative forecast error ÷ Mean absolute deviation
A full period-by-period walkthrough, control-limit derivation, and Excel build are in the tracking signal formula guide.
The tracking signal asks whether the directional error is large relative to normal forecast noise. It can be used as an exception trigger, but a universal threshold is risky. The appropriate control limit depends on demand pattern, aggregation, service risk, item value, and how quickly the process can respond.
Using the four-month example above: the cumulative error is +450 and the mean absolute deviation is (100 + 150 + 150 + 50) ÷ 4 = 112.5, so the tracking signal is 450 ÷ 112.5 = 4.0. Many teams set review triggers around ±4, which would put this process exactly at the alarm line — matching what the monthly table already shows: four positive errors in a row.
Use bias percentage for an interpretable business view, unit bias for operational exposure, and a tracking signal for statistical monitoring. Do not let one replace the others automatically.
What causes forecast bias?
Persistent forecast bias usually comes from the system around the forecast, not a planner’s arithmetic. Incentives, targets, stale overrides, distorted history, slow models, lifecycle assumptions, and aggregation can all push repeated errors in one direction. Common causes include:
- Targets disguised as forecasts. A growth goal is entered as expected demand and propagated into inventory or capacity.
- Incentive effects. Teams under-forecast to make quotas easier to beat or over-forecast to secure inventory and capacity.
- Overrides without expiration dates. A promotion or customer assumption stays in the forecast after the event changes.
- Stockout-distorted history. Shipments are treated as demand even when the business could not supply what customers wanted.
- Slow models. A smoothing method responds too gradually after a structural demand change.
- Double counting. Baseline demand already includes part of the pipeline or promotion later added as an override.
- Lifecycle errors. Launch curves, substitutions, or phase-outs are mapped incorrectly.
- Aggregation masking. Over-forecasting one SKU cancels under-forecasting another at family level even though both create operational problems.
The aggregation trap
Bias should be measured at the level where a decision is made. Imagine Product A is over-forecast by 300 units and Product B is under-forecast by 300. The family bias is zero, but the plant may still hold excess A inventory while expediting B.
Review bias through several lenses:
- product family for S&OP decisions;
- SKU-location for replenishment and service risk;
- customer, channel, salesperson, or region for commercial assumptions;
- forecast horizon or lag, such as one month versus six months ahead;
- baseline versus final consensus forecast to test whether overrides add value.
Also preserve the original forecast version. Comparing actual demand with a forecast revised after the fact produces a flattering metric and no learning.
Override scoring has a natural home in the monthly demand review, where every assumption already carries a named owner.
How do you fix forecast bias?
Fix bias as a closed management loop. Do not apply a blanket correction factor until you know whether the bias is stable, material, and caused by something that persists.
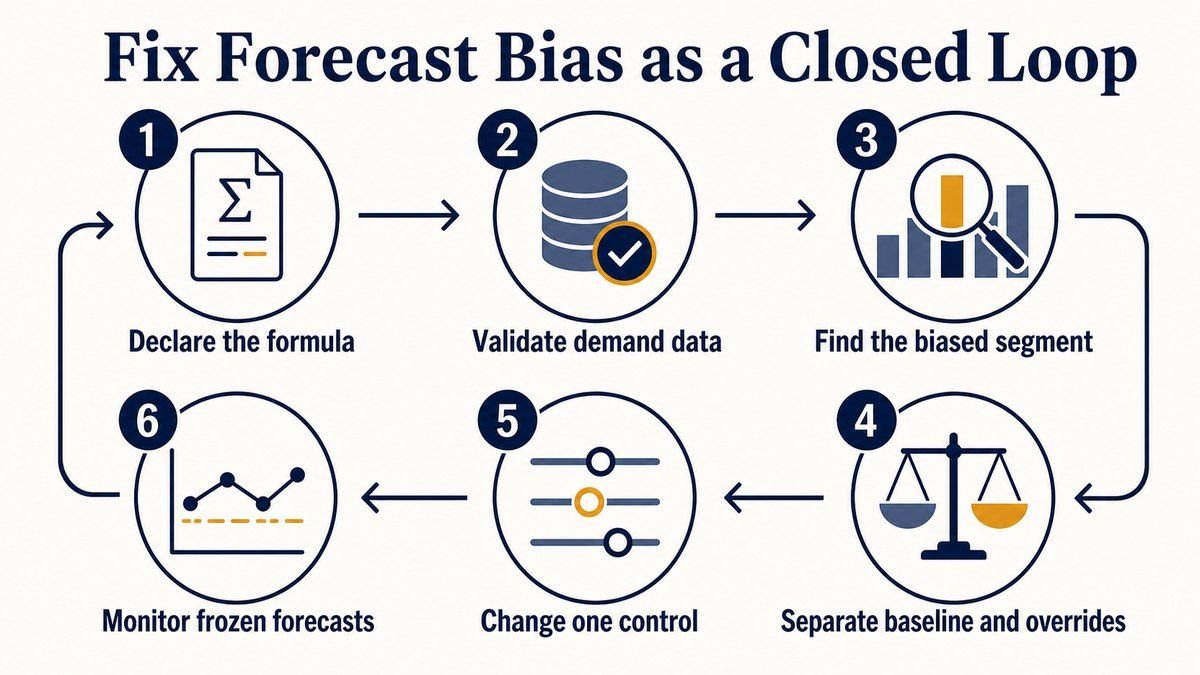
- Declare the convention. Write the error formula, sign meaning, unit, hierarchy, lag, and date range on the report.
- Confirm the demand data. Correct stockouts, returns, substitutions, abnormal orders, missing periods, and one-time events.
- Segment the bias. Find which product, customer, location, lifecycle stage, or forecaster contributes most of the directional error.
- Separate baseline from overrides. Calculate whether commercial overrides improve or worsen bias and absolute error.
- Trace the assumption. Link the error to a named driver such as a promotion, pipeline probability, phase-out date, or customer ramp.
- Change one control. Recalibrate the model, expire an override, revise a stage probability, correct history, or change the item’s fulfillment policy.
- Monitor the next frozen cycles. Confirm that bias improves without causing unacceptable absolute error or service risk.
The corrective action can sit outside the forecasting model. If a highly variable configured item remains impossible to forecast, the manufacturing planning response may be shorter lead time, component commonality, postponement, or make-to-order control.
What should a forecast-bias dashboard show?
A forecast-bias dashboard should show direction, magnitude, volume, time, and ownership at the decision level. It also needs the formula and sign convention, an absolute-error measure, the frozen forecast lag, and enough segmentation to identify which assumptions create the bias. Include:
- the formula and sign convention;
- unit bias and bias percentage;
- an absolute-error measure such as MAE or WAPE;
- actual demand volume, so low-volume percentages are not misread;
- baseline and final forecast results;
- forecast value added from overrides;
- the frozen forecast lag used for the decision;
- top positive and negative contributors;
- a time-series view rather than only a rolling total.
Use thresholds as prompts for investigation, not automatic proof of poor performance. An item can have high percentage bias because actual demand is tiny; another can show a modest percentage but create a large cash or service exposure.
Forecast bias FAQ
What is a good forecast bias?
Zero is the theoretical center, but no single acceptable percentage fits every business. Set limits by decision level, volume, service consequence, item value, demand pattern, and horizon. A narrow limit may suit stable high-volume products; intermittent spare parts need a different control design.
Is negative forecast bias bad?
The sign alone is not good or bad until the formula is known. With Forecast − Actual, negative means under-forecasting; with Actual − Forecast, negative means over-forecasting. Either direction can be costly when persistent.
How do you calculate forecast bias in Excel?
If forecasts are in cells B2:B13 and actuals are in C2:C13, use =IFERROR((SUM(B2:B13)-SUM(C2:C13))/SUM(C2:C13),”N/A”) for the Forecast − Actual percentage. Format numeric results as a percentage and label the convention. Returning “N/A” for a zero actual total is safer than recording 0%, which would falsely imply no bias.
The practical takeaway
Forecast bias is not another score to decorate a planning dashboard. It is a clue that the same assumption or incentive is pushing decisions in one direction. Declare the sign convention, measure bias beside absolute error, drill down to the level where inventory or capacity decisions occur, and test whether human overrides improve the baseline.
The most productive review ends with an owner and one changed control. The goal is not to defend last month’s forecast; it is to prevent the same directional mistake from shaping next month’s production plan.