
Forecast value added (FVA) measures whether each step of a forecasting process actually improves the forecast, by comparing every step’s error against the step before it and against a naive baseline. The definition comes from Michael Gilliland’s work at SAS: the change in a performance metric attributable to a particular step or participant in the forecasting process. A positive FVA means the step earned its keep; a negative FVA means people worked hard to make the forecast worse.
That second outcome is not rare, which is the entire reason the metric exists. FVA is less a new accuracy measure than an audit of effort: it asks which meetings, models, and overrides deserve to survive.
What forecast value added measures
Accuracy metrics grade the final forecast; FVA grades the process that produced it. A company can post a respectable 20% MAPE while a naive forecast would have scored 18% with zero effort, and no accuracy report will ever surface that fact. FVA surfaces exactly that fact, step by step.
The IBF glossary frames FVA as evaluating the performance of each step and each participant to determine which adds value and which does not. In practice, the steps being judged are the ones most monthly cycles share: a statistical baseline, causal or market inputs, sales and marketing overrides, and the consensus number that leaves the demand review.
The FVA formula and the naive baseline
FVA is a subtraction. Using an error metric where lower is better, such as MAPE or WAPE:
FVA of a step = error of the comparison forecast − error of the step’s forecast
Positive FVA means the step reduced error. Two comparisons matter for every step: against the immediately preceding step, which isolates that step’s contribution, and against the naive baseline, which anchors the whole chain to a do-nothing alternative. Which error metric sits inside the subtraction changes what “value” means, so declare it; the trade-offs between MAPE, WAPE, and their relatives are covered in the forecast accuracy metrics guide.
The naive forecast is the do-nothing number: a random walk (next month equals last month) or a seasonal random walk (next month equals the same month last year) for seasonal businesses. Eric Wilson of IBF adds a sharper test in his FVA analysis guide: ask what numbers the company would actually run on if the forecasting function disappeared, because that, not a textbook construct, is the baseline the process must beat.
A stairstep example you can recompute
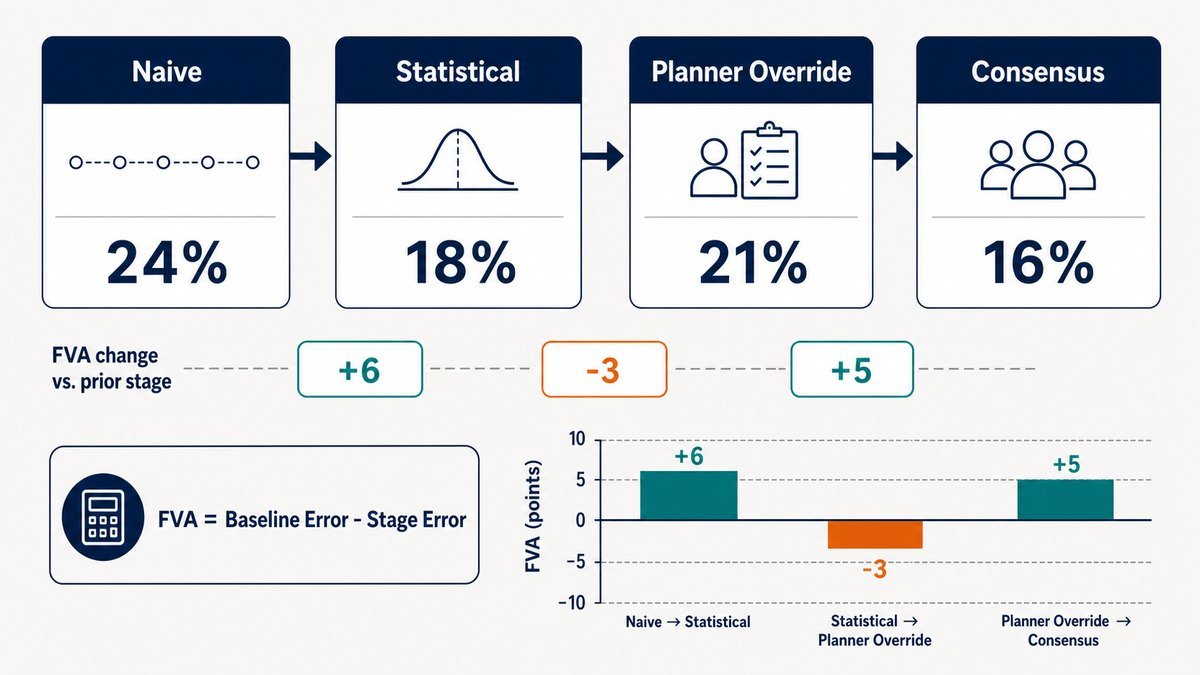
The stairstep report is FVA’s standard artifact. The numbers below are an illustrative example: one product family, twelve months of frozen forecasts, MAPE as the chosen metric.
| Process step | MAPE | FVA vs previous step | FVA vs naive |
|---|---|---|---|
| Naive (random walk) | 32% | — | — |
| Statistical baseline | 24% | +8 pts | +8 pts |
| After sales overrides | 26% | −2 pts | +6 pts |
| Consensus final | 25% | +1 pt | +7 pts |
Each FVA cell is one subtraction: the statistical step scores 32 − 24 = +8 points against naive; the override step scores 24 − 26 = −2 points against the baseline it modified; the final consensus lands at 32 − 25 = +7 points of total value added. Reading down the third column tells the process story: the model helps, the overrides hurt, and the demand review claws one point back.
The action that follows is surgical, which is FVA’s advantage over a plain accuracy target. Nobody needs to defend the whole process or scrap it; the overrides need owners, reasons, and expiry dates, and the override authors need feedback. Both mechanisms already live in the demand review process, which is where a stairstep report naturally gets presented.
What FVA typically reveals
The uncomfortable finding is how often elaborate processes lose to doing nothing. Steve Morlidge’s study of more than 300,000 real forecasts, highlighted in the Gilliland, Tashman, and Sglavo collection Business Forecasting: Practical Problems and Solutions and summarized in Wilson’s guide linked above, found 52% performed worse than a random walk. Half the forecasting effort in that sample subtracted value.
The pattern inside that number repeats across companies. Statistical baselines usually add value against naive. Judgmental overrides are the coin-flip: they add value when they carry genuine information the history cannot know (a confirmed ramp, a distribution loss) and destroy it when they re-forecast the baseline from instinct or push the number toward a target. Persistent one-directional overrides are a bias problem wearing an FVA costume, and the diagnosis tools in the forecast bias guide apply directly: score overrides by owner, compare baseline against final, and the source of the leak names itself.
Used this way, FVA doubles as a training loop rather than a scoreboard. Showing a sales team that its inputs moved MAPE from 24% to 26% redirects the conversation from whose number wins to which information genuinely improves the plan.
Running FVA without the pitfalls
FVA has sharp critics, and the strongest critiques, such as Lokad’s essay on the method, target real failure modes rather than the core idea. Four boundaries keep the analysis honest:
- Noise is not signal. A one-point FVA difference in one month decides nothing. Judge steps on a trend across many cycles, the same discipline any accuracy metric demands.
- Steps interact. A consensus step can look good in the stairstep while merely undoing a bad override before it. Read adjacent rows together before assigning credit or blame.
- Accuracy is not money. A step can add accuracy worth less than the meeting time it consumes. Weigh material FVA gains against the cost of producing them, and let trivial ones go.
- FVA is a lens, not a court. One bad quarter does not fire a forecaster; a persistent negative trend retires an activity. The target is waste in the process, never the people in it.
Keep the mechanics symmetrical too: every step must be scored at the same aggregation level, the same lag, and against the same frozen actuals, or the stairstep compares apples to invoices.
Forecast value added FAQ
What is forecast value added?
Forecast value added is the change in a forecast performance metric attributable to one step or participant in the forecasting process, measured by comparing each step’s error against the previous step and a naive baseline. Positive FVA means the step improved the forecast; negative means it made the forecast worse.
What is FVA in supply chain management?
In supply chain planning, FVA audits the monthly forecasting chain: statistical model, market inputs, sales overrides, consensus meeting. It identifies which activities justify their cost and which quietly degrade the demand plan feeding inventory and production decisions.
What is a good FVA result?
A healthy process shows sustained positive FVA against naive for the chain overall, with each retained step contributing positive value over a trend of many cycles. There is no universal target number; the useful standard is that no step shows persistently negative FVA without being changed or removed.
Should FVA use MAPE or WAPE?
Either works if used consistently at every step; WAPE is usually the better choice for mixed-volume portfolios because low-volume items cannot distort it. Whichever metric is chosen, write it on the stairstep report, since FVA points inherit every property of the metric underneath them.
Next steps
- Compute a naive forecast (random walk, or seasonal random walk for seasonal demand) against the last twelve months of frozen forecasts and actuals.
- Build the four-row stairstep at family level with one declared metric, and read the step-versus-previous column before anyone sees the totals.
- Bring the stairstep to the next demand review: retire or coach the steps showing persistent negative value, and re-run the report quarterly rather than reacting to single months.